
Live Business Central data, right inside Excel.
IBB Reports adds IBB.* functions, a plain-language Ask IBB box and one-click reports to Excel, so your financials pull live figures straight from Microsoft Dynamics 365 Business Central, no copy-paste, no exports.
This guide covers everything: starting a free trial, activating a license, Ask IBB, the functions, the ready-made reports, the Report Designer, and scheduling. Use the menu on the left to jump to a section.
What is IBB Reports
IBB Reports is an Excel add-in by IBB Innovations, LLC. It connects Excel to your Business Central environment and brings the numbers in live through a family of worksheet functions, a guided task pane, and ready-made reports.
- Ask IBB: type what you want in plain English (“income statement for last quarter”) and IBB builds the report.
- Spreadsheet functions: type
=IBB.NL(...),=IBB.GL(...),=IBB.FS(...)and more to pull lists, totals, account balances and full statements. - Ready-made reports: generate a fully formatted Accounts Receivable with Details or Accounts Payable Details aging report, income statement, balance sheet, cash flow, budget-vs-actual and more in a couple of clicks.
- Custom reports & a Report Designer: run saved client templates, or design your own report once and reuse it.
- Always current: refresh and every figure re-reads live from Business Central. Nothing is stored outside your tenant.
Install the add-in
IBB Reports runs in Excel on the desktop and on the web. Your Microsoft 365 administrator deploys it to your organization; once deployed, it appears automatically for everyone, there is nothing to download.
For everyone
Open Excel (desktop or the web). You'll see an IBB Reports tab on the ribbon. Click IBB Reports on that tab to open the task pane, then start a free trial or activate.
For the Microsoft 365 administrator (org-wide deploy)
- Open the Microsoft 365 admin center → Settings → Integrated apps (or Add-ins).
- Choose Upload custom apps → I have a URL for the manifest file.
- Paste the manifest URL IBB Innovations provided (it points to
reports.ibbinnovations.com), assign it to Everyone (or the right group), and deploy. - Allow a short while for Microsoft to push it to users' Excel.
Free trial & activation
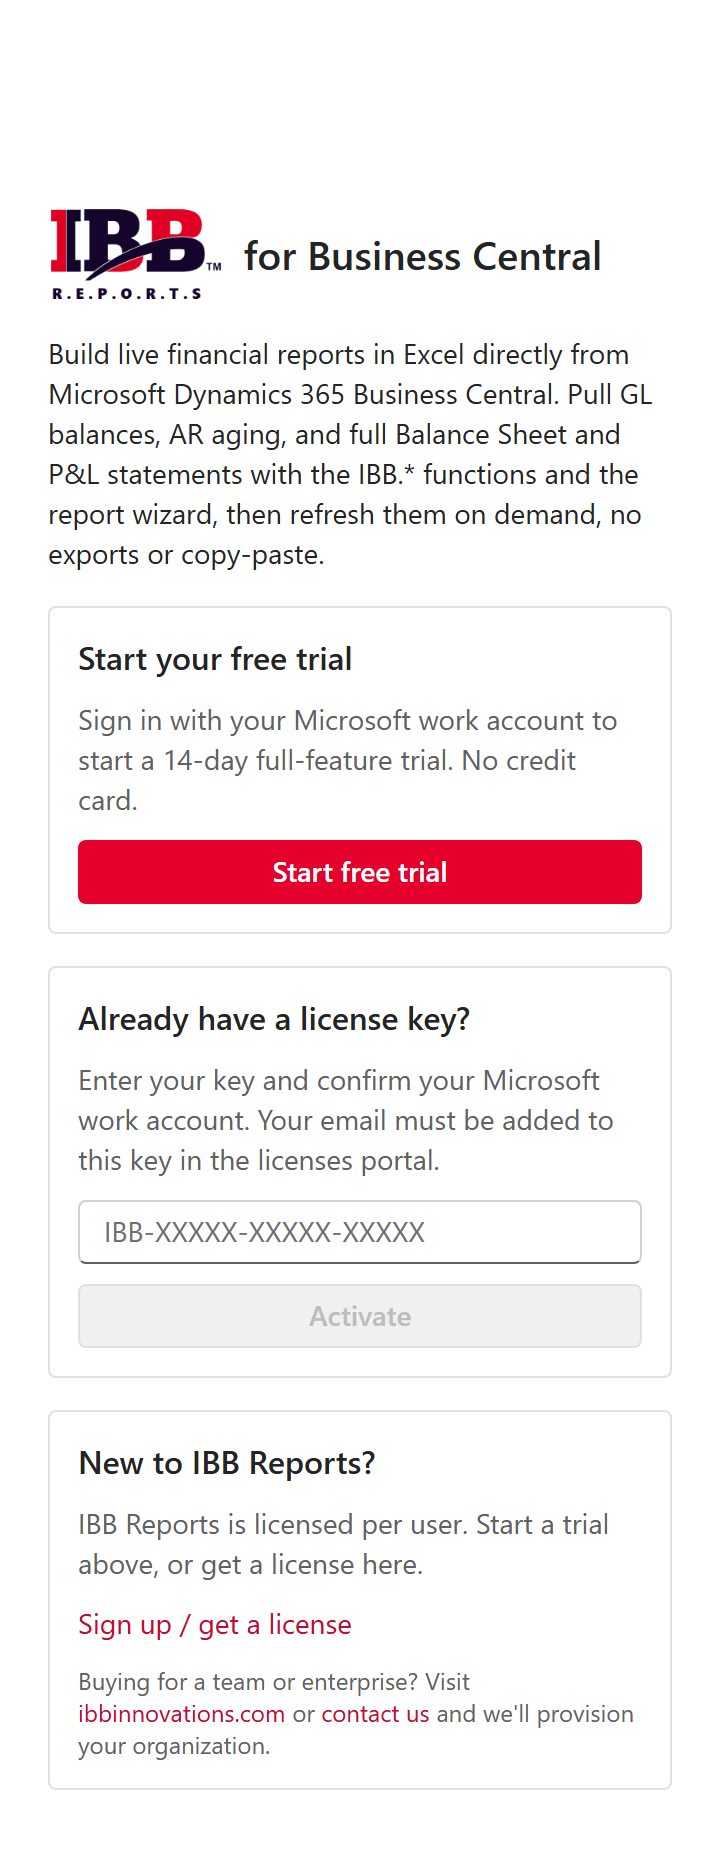
The first time you open the task pane you'll see the start screen. There are two ways in.
Start a free trial
Click Start free trial and sign in with your Microsoft work account. You get a 14-day, full-feature trial, no license key and no credit card required.
Activate with a license key
- Enter your
IBB-XXXXX-XXXXX-XXXXXkey from your welcome email. - Click Activate and confirm your Microsoft work account. Your email must already be added to that key.
Once you're in, you stay signed in on that device.
For administrators: adding people to a key
Each client gets one license key. In the licenses portal you add the email of every person who should use it (a “seat”). Add a seat to grant access, remove it to cut someone off; the key itself never changes. Plans (Starter / Pro / Enterprise) are set on the key. Need a key for a team? Visit ibb-reports.ibbinnovations.com.
The task pane at a glance
Everything lives in one pane that shows one page per function. The header has three things: the IBB Reports logo (click it to return to the Ask IBB home), your active Company, and the Menu button that opens every page.
Open the Menu (top-right) and you'll find:
| Menu group | Opens |
|---|---|
| Reports | Ask IBB, Statements, AR aging, AP aging, Consolidating statement and GL by company (plans with consolidation), Custom reports (and your client's report pack, if any). |
| Work with data | Companies, Run / refresh, Drill-down. |
| Insert | Function builder. |
| Distribute | Scheduled reports. |
| Setup | Report options, Settings, Get support. |
The bottom of the Menu also has Reload and Sign out. The ribbon's own buttons open the pane directly on the matching page.
Ask IBB
The home screen is a single box: type what you want in plain English and IBB works out which report to build. It's the fastest way to get a finished report without knowing the functions or hunting through menus.
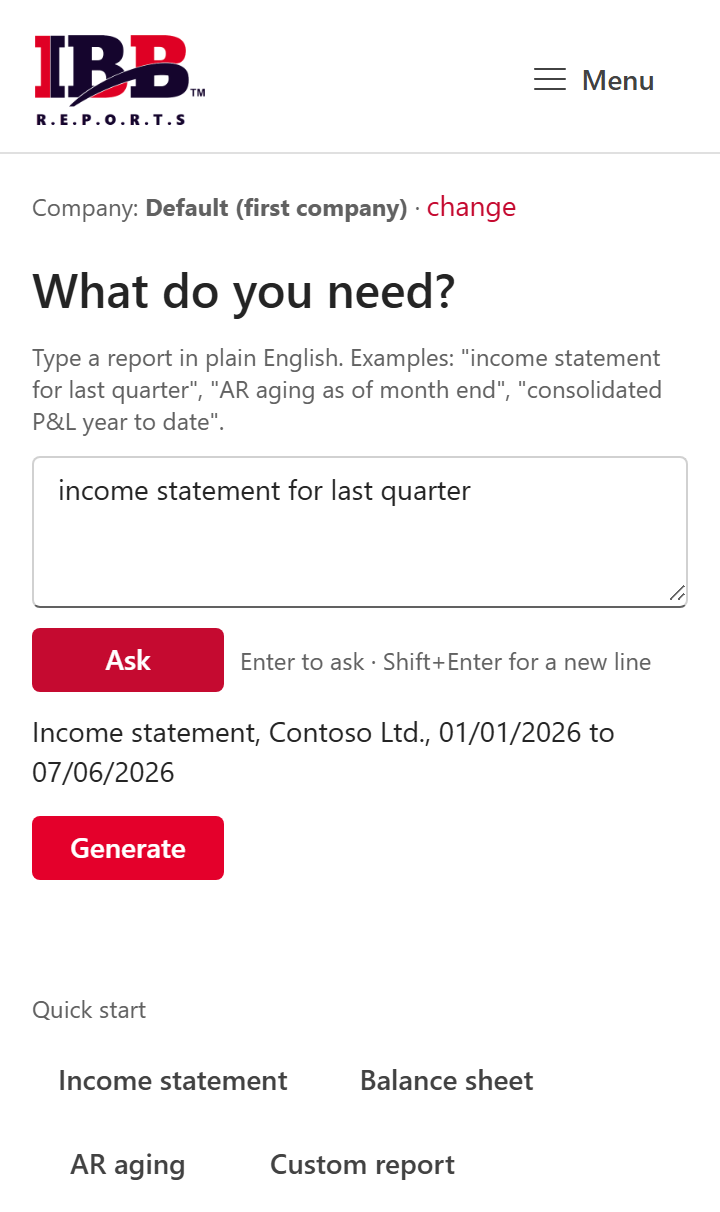
- On the Home screen, type a request, for example “income statement for Contoso, last quarter” or “AR aging as of March 31”.
- IBB reads it and shows back what it understood: the report, the company and the dates.
- If it needs to know which company, pick one from the dropdown it shows.
- Click Generate. The finished report lands on a new worksheet.
Ask for a budget comparison, for example “income statement vs budget for March 2024”, and IBB opens the Budget vs Actual card with your dates filled in. Pick the budget, then Generate.
Run & refresh
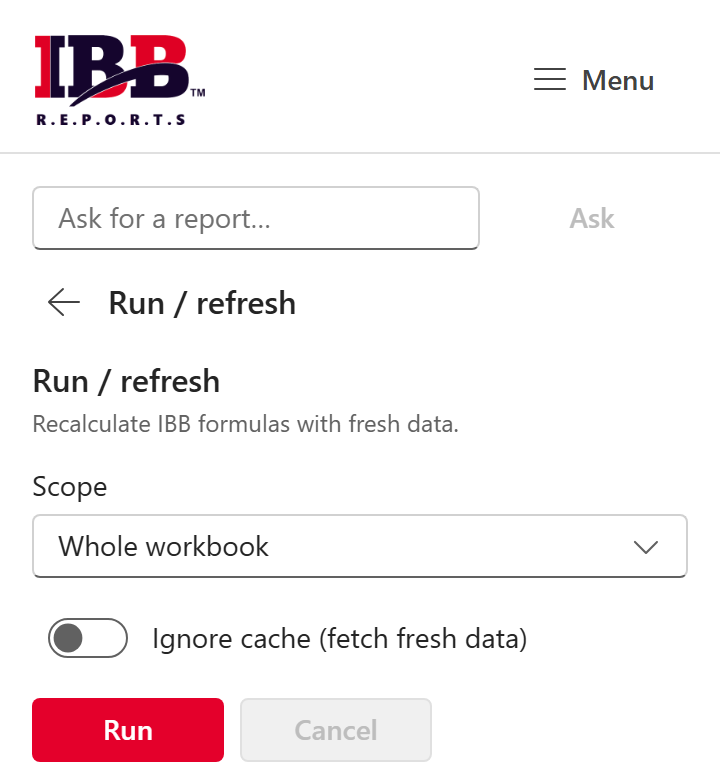
The Run / refresh page recalculates your IBB.* formulas with fresh figures from Business Central.
- Scope: refresh the whole workbook, the active sheet, or just your selection.
- Ignore cache: turn on to force a fully fresh pull (results are briefly cached for speed).
- Run / Cancel: start or stop the refresh.
The ribbon's Run button is a menu with three speeds: Run (fresh), Run from Cache (fast) and Run in Background (keeps Excel responsive).
Drill-down
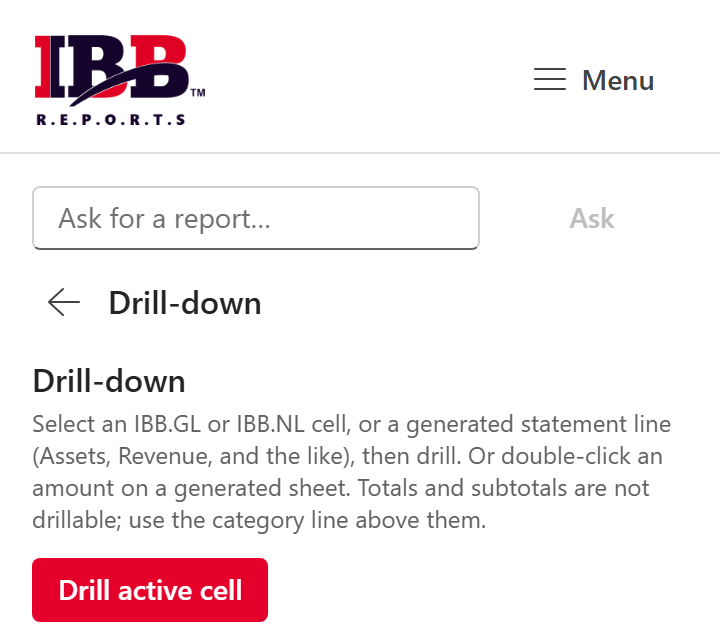
Drill-down shows the underlying Business Central entries that make up a number.
- Double-click an amount on a statement or custom report IBB generated and the pane opens the Drill-down page with the records behind that cell.
- Or select a cell holding an
IBB.GL,IBB.NLorIBB.FSvalue and click Drill active cell (also on the ribbon as Drill Down).
IBB.* functions
You can type the functions directly into any cell, or build them with the Function builder (Menu → Insert, or the ribbon's Insert Function): pick a function, fill the boxes, see a live formula preview, and click Insert into cell.
Every function reads live from your active company (switch it from the header or the Companies page). Filters use Business Central's own syntax, for example >0, 10000..19999, SALES|ADMIN.
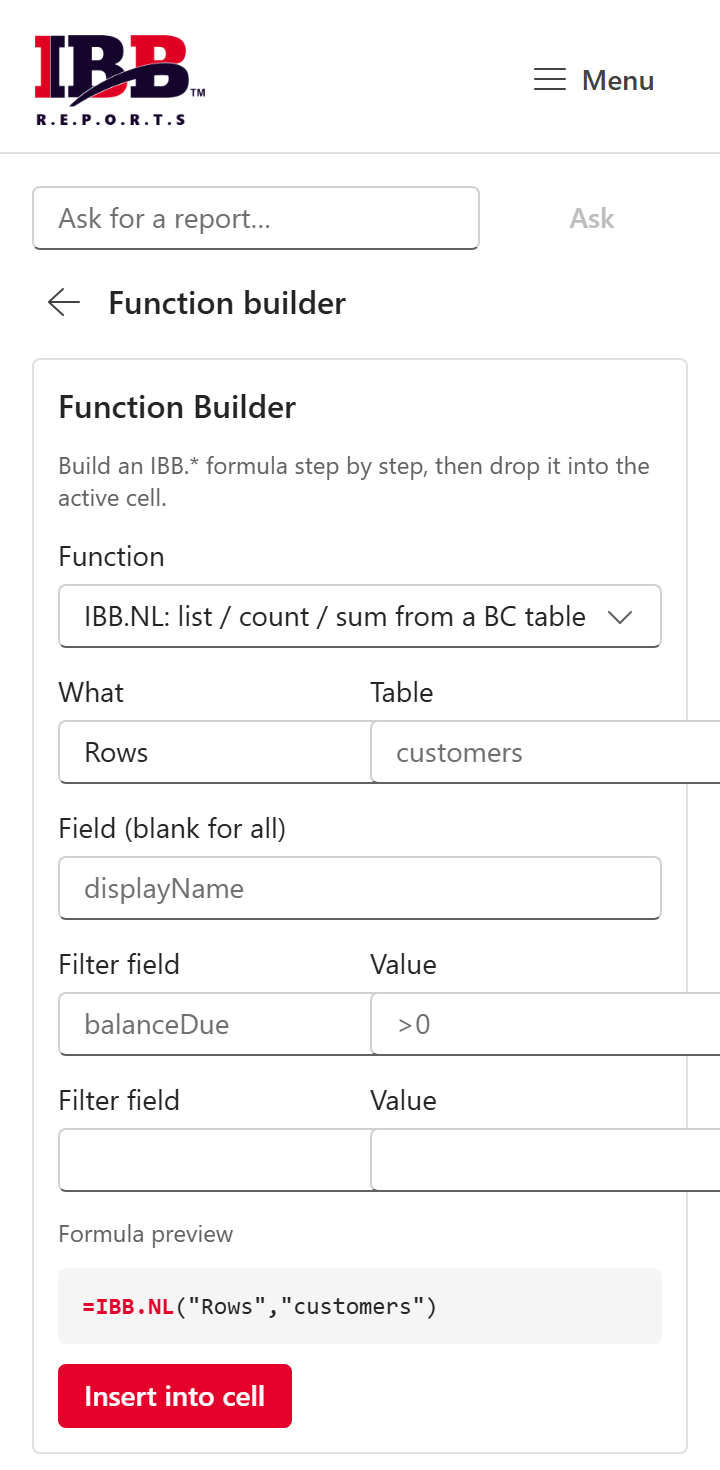
=IBB.NL("Rows", "customers", "displayName", "balanceDue", ">0")Returns rows, a count, a sum, average, min or max from a table. First argument is what you want (Rows, Count, Sum, …), then the table, an optional field, and optional filter field / value pairs.
=IBB.GL("40000..49999", "2024-01-01", "2024-12-31", "DEPARTMENT=SALES")The net movement (debits − credits) for an account range over a date range. Add trailing tokens for dimensions (DEPARTMENT=SALES), consolidation (Company=A|B), a breakdown (BreakBy=DEPARTMENT) or a budget (Budget=<name>).
=IBB.FS("income", "2024-01-01", "2024-12-31")Spills a complete statement as [category, amount] rows, built from Business Central's own account categories. kind = income, balance, trialbalance or cashflow. Add a company for consolidation, or TRUE for a comparative (current vs prior with variance). Comparative isn't available for cash flow yet. Generate two cash flow statements side by side instead.
The formula always shows category totals. To list every account, use Generate to sheet on the Statements page with Account detail.
=IBB.AR("2024-03-31", 30)Aging of open customer entries as of a date, in buckets of the given period length. (For the fully formatted report, use the AR aging report instead.)
=IBB.AP("2024-03-31", 30)Aging of open vendor entries as of a date, in buckets of the given period length. Amounts keep Business Central’s sign, so invoices you owe are negative. (For the fully formatted report, use the AP aging report instead.)
=IBB.NF(A2, "displayName")Looks up a single field value from a record key sitting in another cell, handy alongside an IBB.NL list.
=IBB.NP("Companies")Utility operations: list Companies or DataSources, list Dimensions / DimensionValues, and data helpers like DateFilter, Replicate, Join, Split, Union, Intersect and Difference.
Financial statements
Open Statements from the Menu (or the ribbon's Report Wizard) to build a finished income statement (P&L), balance sheet, trial balance or cash flow. Set the Start and End dates, pick the Statement and the Detail, then:
- Generate to sheet: a fully formatted, sectioned statement on its own worksheet (assets / liabilities / equity, or revenue / cost of goods sold / expenses) with totals that foot.
- Generate comparative: the same statement with current vs prior period, variance and variance %. Comparative isn't available for cash flow yet. Generate two cash flow statements side by side instead.
- Insert as formula: drops a live
=IBB.FS(...)that spills the statement and refreshes when you change the dates. Formulas always show category totals.
For one-click access, the ribbon's Balance Sheet and P&L buttons open Statements with that statement already selected; just set the dates and Generate.

Statement and detail
Pick Income statement, Balance sheet, Trial balance or Cash flow. Detail: Category totals shows one line per account category; Account detail lists every account, grouped by the categories and subcategories set up in Business Central. Turn on Show accounts with no balance for a fixed list of rows that stays the same from period to period. The page remembers your choices for next time.
- Trial balance with Account detail has one more switch, Show opening balance and period activity. It adds each account's opening balance, the period's debits and credits, and the closing balance.
- Cash flow is always shown as category totals, so Detail and the zero-balance switch don't apply to it.
Year to date and your fiscal year
Year to date starts on the first day of your fiscal year, read from Accounting Periods in Business Central. If a year hasn't been set up there, the report says which start date it assumed. This applies to the YTD date button, the Year to date columns of Budget vs Actual, P&L by Partner year to date, and the Report Designer's YTD columns. When several companies are combined, the report uses the fiscal year most of them share and names any company that differs.
Budget vs Actual
The Budget vs Actual card is on the Statements page, below the Report Wizard. Pick a budget from Business Central, set the dates, and choose account or category level. Period and Year to date each show Actual, Budget, Fav/(Unfav) and Var %.
- Pick the Budget. The list shows the G/L budgets set up in Business Central for the company; you can also type a budget name.
- Set Start and End for the period you're reviewing.
- Choose the Level: By account or By category. Hide lines with no actual or budget is on by default; turn it off to list every line.
- Click Generate to sheet. The report lands on its own worksheet.
Year to date runs from the first day of the fiscal year that holds the End date (see Year to date). If your period starts before that fiscal year, the report warns you. On the Enterprise plan, Consolidate all companies combines every company's actuals and budgets.
Formula version
Open Formula version on the card, enter one or more account ranges (comma-separated), and click Insert as formulas. Starting at the active cell, IBB inserts one row per range with Account, Actual, Budget, Fav/(Unfav) and Var %, using live IBB.GL formulas. The Budget column reads the budget you picked. Leave the budget blank to type budget figures yourself; type them in Business Central's sign, like the Actual column: revenue and other credits as negative numbers. These formulas keep Business Central's own sign (revenue is negative), and Fav/(Unfav) still reads positive when a line is favorable.
AR aging report
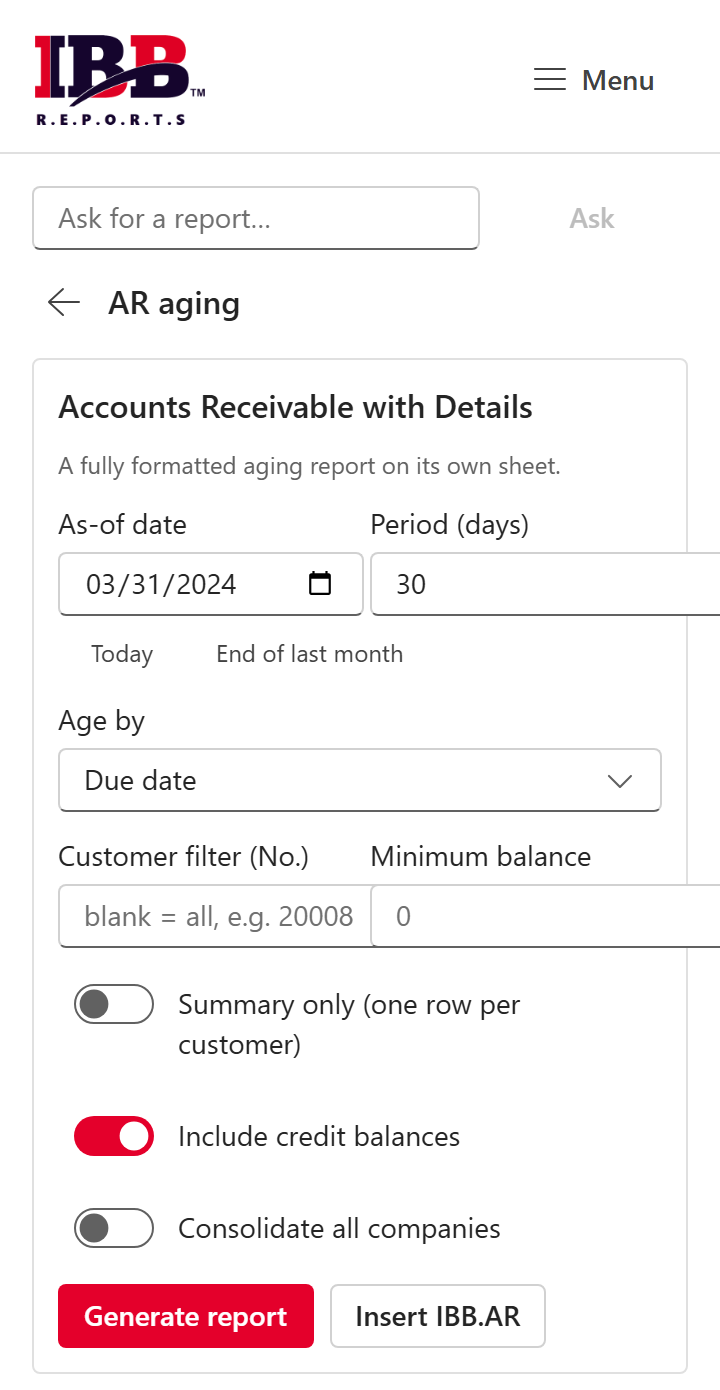
The AR aging page produces a fully formatted Accounts Receivable with Details report on its own worksheet, matching the classic “AR with Details” layout.
- As-of date & Period (days): the cutoff and bucket size (e.g. 30 → Current / 0-30 / 31-60 / 61-90 / 91+).
- Age by: Due date or Posting date.
- Customer filter & Minimum balance: narrow the list.
- Summary only, Include credit balances, Consolidate all companies: toggles.
Click Generate report for the formatted sheet, or Insert IBB.AR for a live version: starting at the active cell, it inserts a small block with a title, an As of Date cell, a Period (days) cell and the column headings, with the IBB.AR formula underneath. The formula reads the block’s own date and period cells, so change either one and it runs again.
mm/dd/yyyy format.AP aging report
The AP aging page produces a fully formatted Accounts Payable Details report on its own worksheet: every open vendor entry as of your date, aged into buckets, with a total row.
- As-of date & Period (days): the cutoff and bucket size (e.g. 30 → Current / 0-30 / 31-60 / 61-90 / 91+).
- Age by: Due date or Posting date.
- Vendor filter & Minimum balance: narrow the list. The minimum applies to the size of the balance, whatever its sign.
- Summary only, Include debit balances, Consolidate all companies: toggles. Turning off debit balances hides the positive lines, such as payments and credit memos not yet applied.
Open it from the Menu (Reports → AP aging), from Quick start on the home screen, from the ribbon’s AP Aging button, or ask for it, for example “AP aging as of month end”. Then click Generate report for the formatted sheet, or Insert IBB.AP for a live version: starting at the active cell, it inserts a small block with a title, an As of Date cell, a Period (days) cell and the column headings, with the IBB.AP formula underneath. The formula reads the block’s own date and period cells, so change either one and it runs again.
The sheet has the classic Accounts Payable Details fields, in the same order: Entry No. (after the Company on a consolidated run), Vendor No., Vendor - Name, Vendor - Contact, Vendor - Phone No., Vendor - Statistics Group, Vendor - Vendor Posting Group, Due Date, Document Type, Document No., Description, Posting Date, Vendor Payment Reference No. (blank if your Business Central has no such field), Reason Code, Currency Code, Balance Due and the aging buckets, then an empty Comment column.
Custom reports
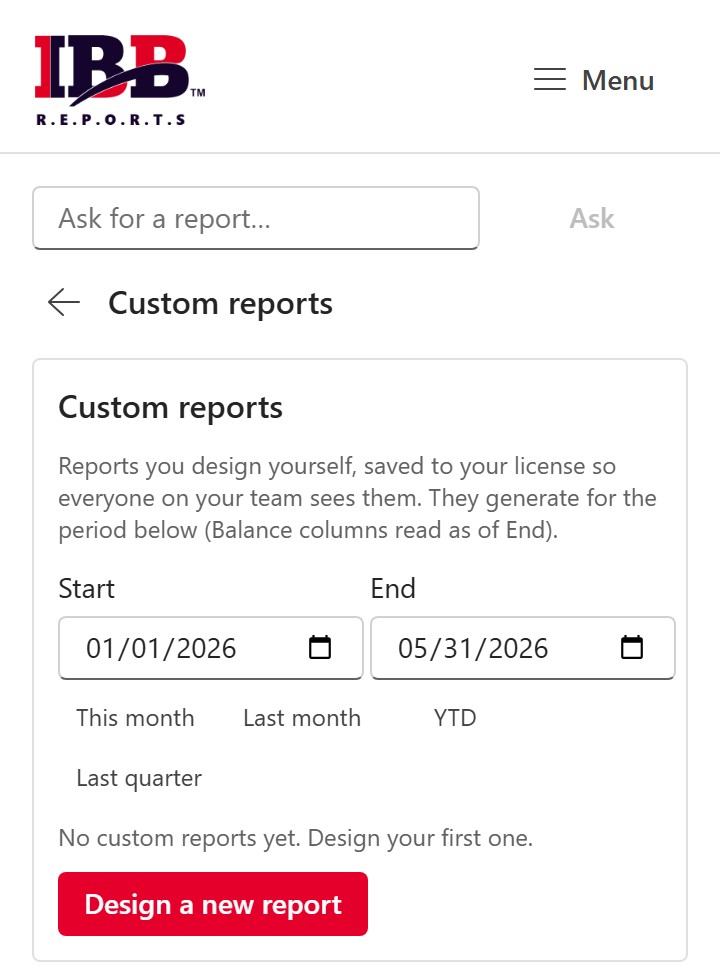
The Custom reports page holds your saved reports: anything you built in the Report Designer, ready to run, edit or delete. Set the period, then generate any of them to its own worksheet.
Plans with consolidation also have two multi-company reports in the Menu:
- Consolidating statement (Menu → Consolidating statement, a card on the Statements page): an income statement, balance sheet or trial balance with one column per company, then Eliminations (when your group is set up for them) and Consolidated. It uses the same Detail and Show accounts with no balance choices as the Statements page.
- GL by company (Menu → GL by company): one row per G/L account and one column per company, then Eliminations (when your group is set up for them) and Consolidated. Pick income statement accounts (net change for the period) or balance sheet accounts (balance at the End date). Double-click a posting account's cell to see its entries; headings, totals, Net Income and the Check line don't drill.
- Trial Balance by Company: every posting account, one column per company, then Eliminations (when your group is set up for them) and Consolidated. Balance sheet accounts show their balance at the End date and income statement accounts their net change from Start to End, so both dates must fall in the same fiscal year. An Opening Retained Earnings line appears when an earlier year's income wasn't closed to retained earnings, and a check row at the bottom should read 0.00 in every column.
- GL Entries: every G/L entry posted in the period, one row per entry, for one company or all of them, sorted by Entry No. within each company. The entries are counted before anything loads: a run over 50,000 entries asks you to confirm, and one over 250,000 is refused with the count per company, so pick a shorter period. Cancel stops after the current batch and marks the sheet INCOMPLETE; a sheet is never cut short without saying so. GL Entries needs version 2.3.0.0 or later of the IBB Reports connector in Business Central.
Intercompany eliminations
For groups set up by IBB, GL Balance by Company and the Consolidating statement can remove balances between your own companies. IBB configures the list of intercompany accounts with you. Eliminated amounts offset between the companies shown: each elimination takes the same amount off both sides of an intercompany balance, so the consolidated figures still balance. Amounts that don't reconcile, because the two sides of an intercompany balance don't agree, appear on the Intercompany difference line. Other consolidated reports and in-cell formulas show combined figures and say so.
- On a balance sheet, Total Assets and Total Liabilities & Equity change by the same amount, so the statement still ties. On an income statement, eliminated income and expense offset each other, so consolidated Net Income is the companies' combined Net Income.
- When the two companies of an intercompany balance are both in the report, the Intercompany reconciliation below it shows each company's side and the difference.
- When your group is set up, both reports show an Eliminate intercompany switch with the number of configured entries (an entry can be one account, a range like 13910..13919, or a list). It is on by default; turn it off for combined figures without eliminations.
- The Consolidated column is the sum of the company columns plus Eliminations. On a trial balance, its Total Debits and Total Credits add up its own lines, like every other column, so they can be smaller than the company totals added together.
- A balance with a company that isn't in the report isn't eliminated, and the report lists it.
- Eliminations cells aren't drillable. Double-click a company's cell to see its entries.
Report Designer
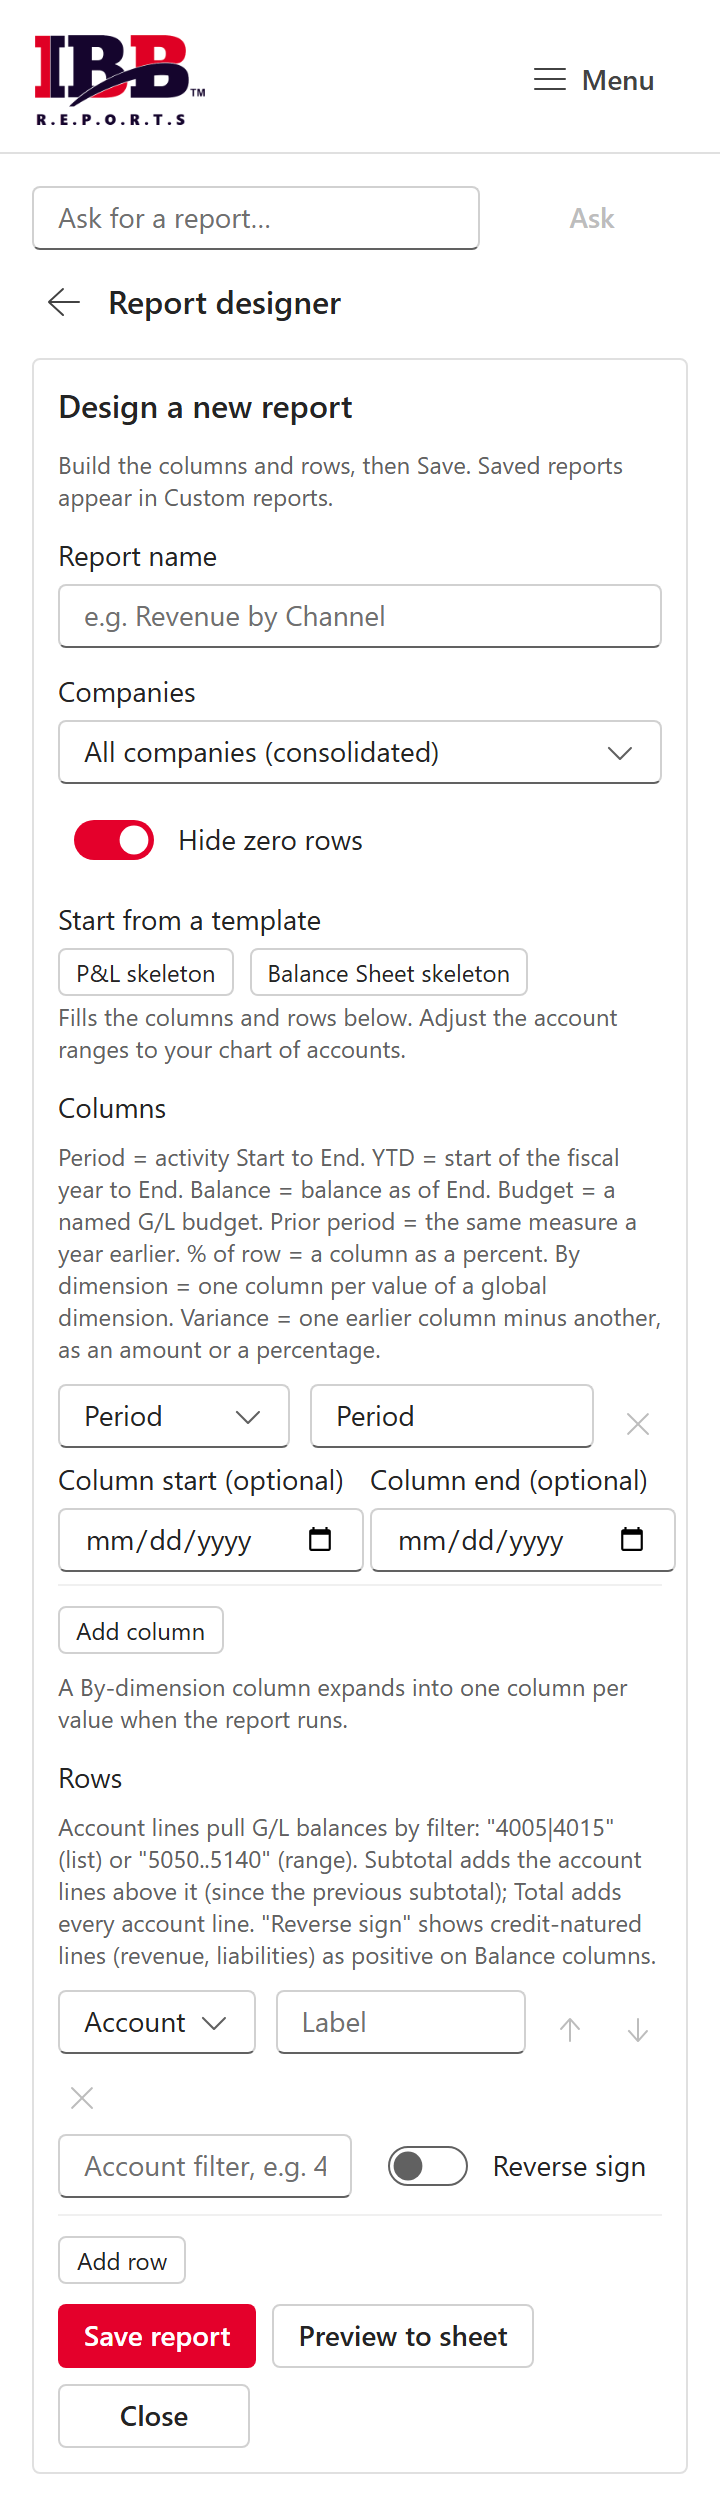
The Report Designer (Menu → Custom reports → Design a new report, or the ribbon's Report Designer) lets you build a report once and save it to your license key for reuse, no formulas required.
- Start from a P&L or Balance Sheet template, or a blank form.
- Add columns: Period, Year-to-date, Balance, Budget, Prior period, % of row, Variance, or a By-dimension breakdown. Year-to-date runs from the start of the fiscal year to End (see Year to date). A Budget column takes a budget from Business Central.
- Add rows: section headers, account lines (with an account number or range like
4000..4999), subtotals, a grand total, and spacers. - Under Companies, choose Active company only or All companies (consolidated), which needs the Enterprise plan. Then choose whether to hide zero rows.
- Save it. It now appears on the Custom reports page for anyone on your key.
Add a Variance column to compare two earlier columns, as an amount or a percentage. For example, Period minus Budget, or Period against Prior period with Show as % turned on.
From the saved list you can Generate a report for any period, Edit it, Save as copy, or Delete it.
Schedule & distribute
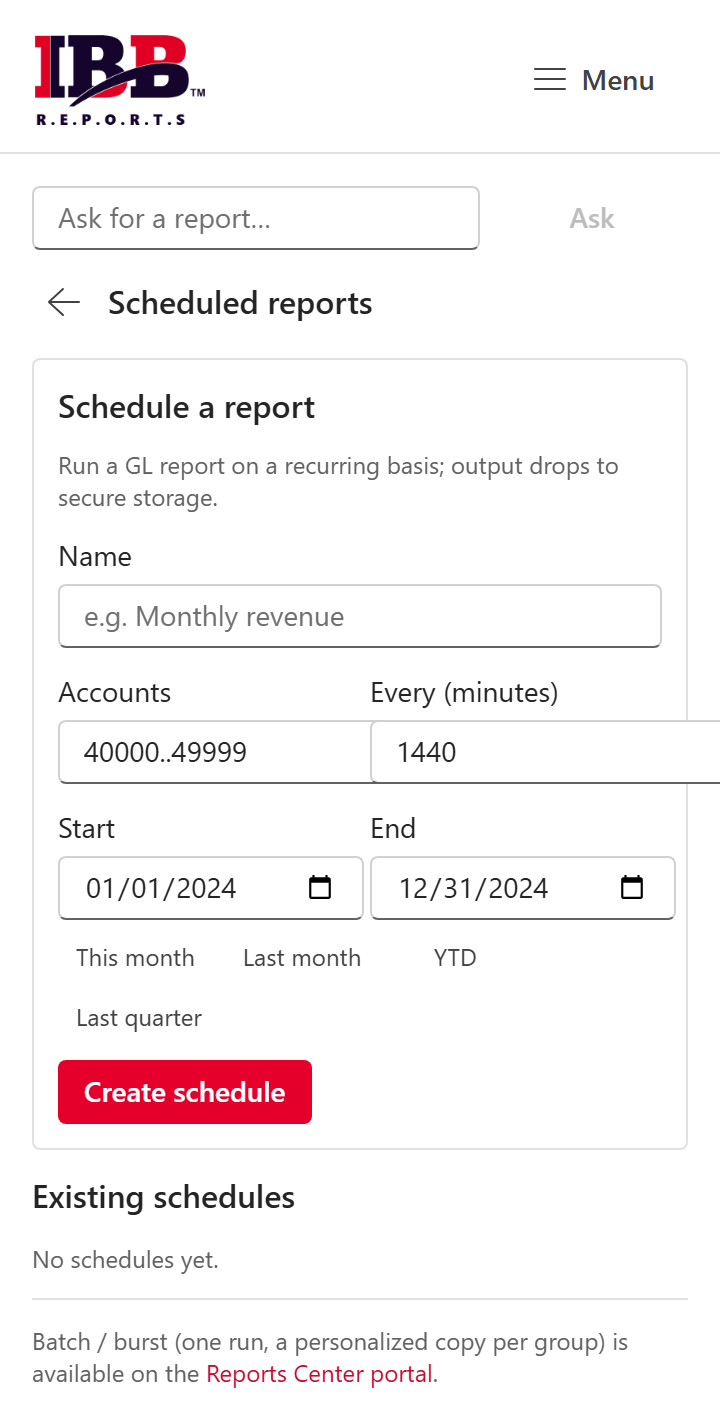
The Scheduled reports page lets a report run on its own and be delivered, so no one has to open Excel.
- Give the schedule a name, an account range, a start/end date and an interval in minutes.
- Click Create schedule; it appears in the list below where you can Run it now, Disable/Enable or delete it.
- Output is rendered to an Excel file and delivered to your configured destination; alerts can fire when a value crosses a threshold.
The ribbon's Batch Wizard, Word Export and Upload round out distribution.
Report options
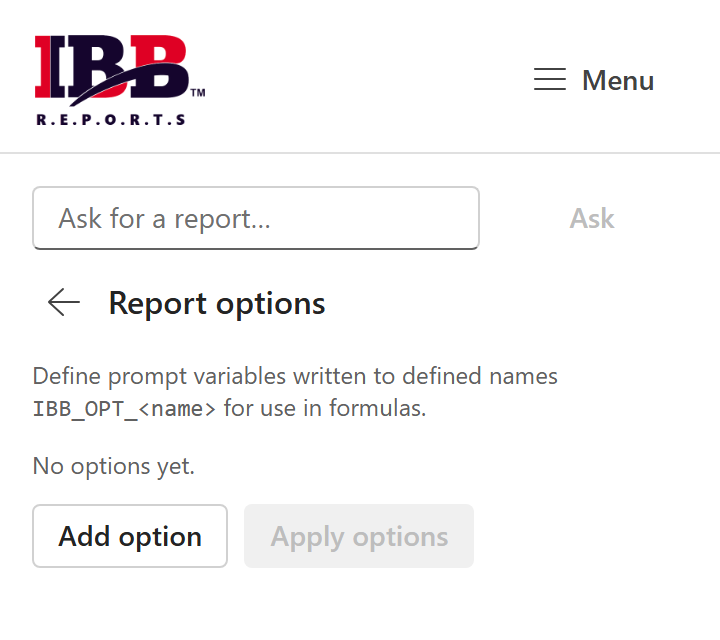
The Report options page (Menu → Setup) lets you define named prompt variables written to defined names (IBB_OPT_<name>) that your formulas can reference.
Add an option, give it a value, and click Apply options to write the named ranges into the workbook. It's an easy way to drive several formulas (dates, account ranges, company) from one place.
Companies
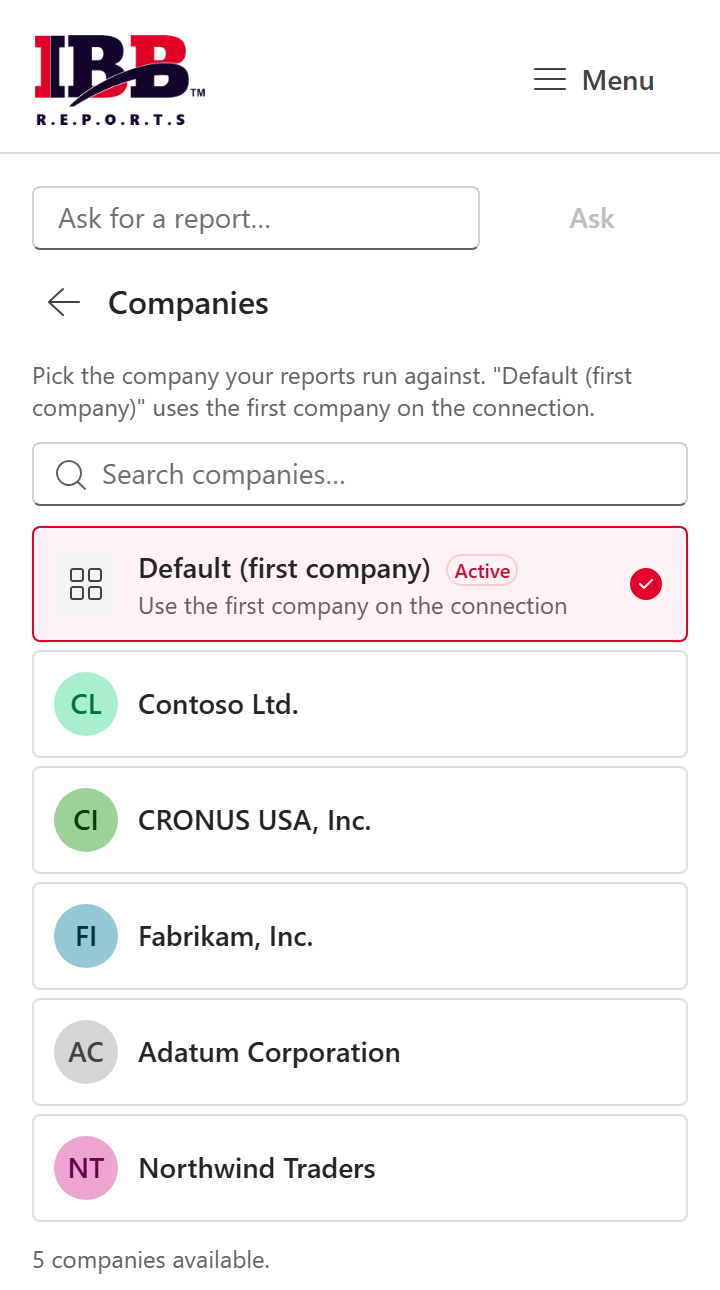
The active Company drives every function and report. Open the Companies page (the company button in the header, Menu → Companies, or the ribbon's Companies) to switch it. Your choice is remembered and used by both the task pane and the in-cell IBB.* functions.
To combine companies, most reports accept a consolidation option (“all companies”), and functions take "*" for all or "A|B" for a subset.
Settings
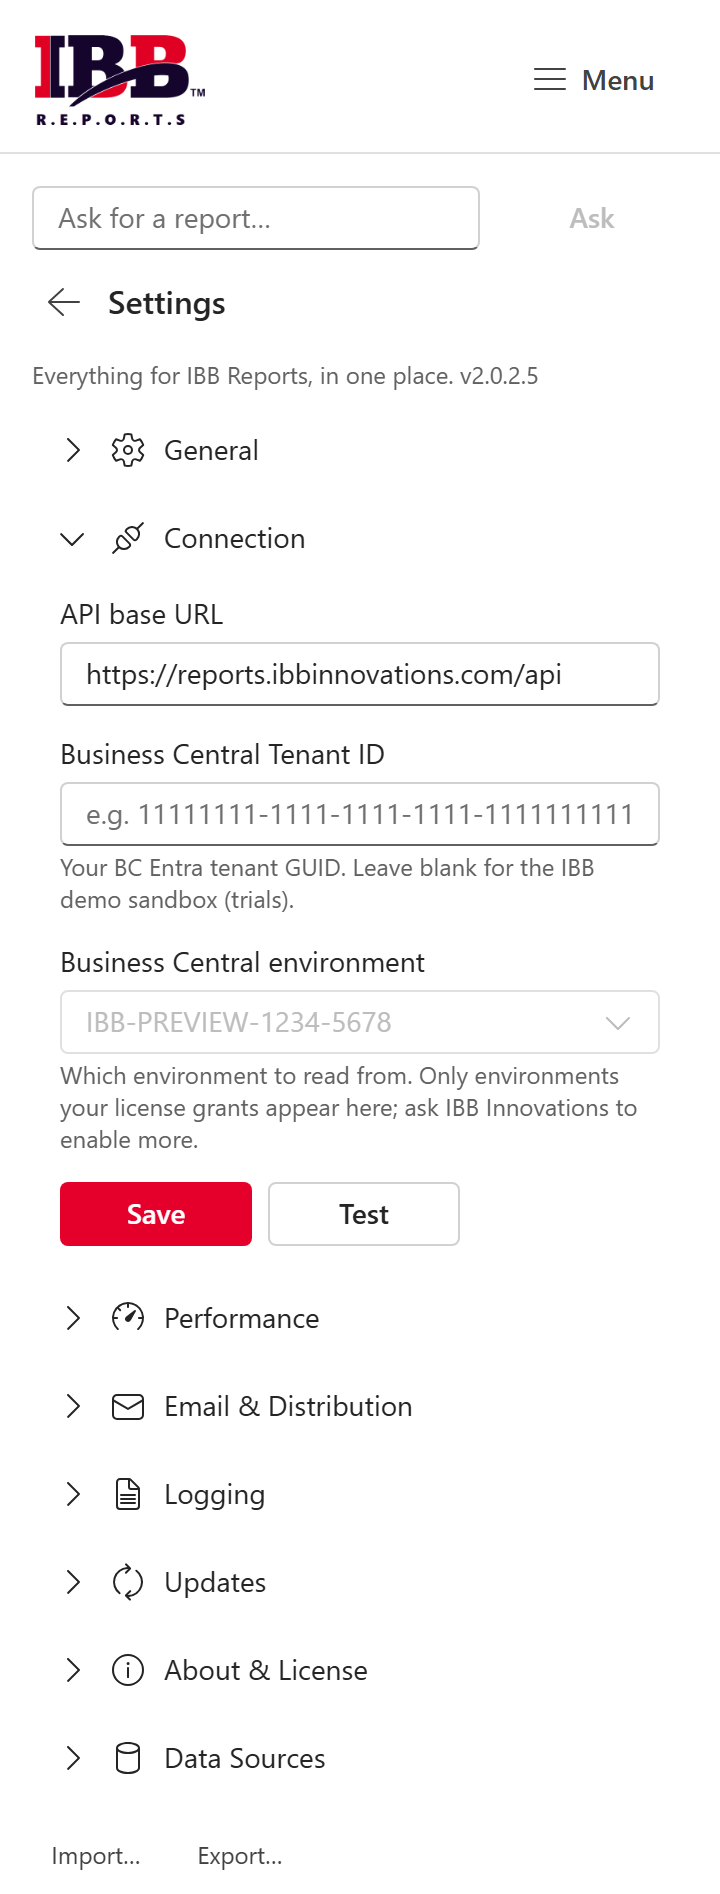
The Settings page is a set of collapsible sections (all closed by default; open the one you need):
- General: interface language and default run scope.
- Connection: the API base URL, your Business Central Tenant ID, and the Business Central environment to read from. Only environments your license grants appear here.
- Performance: cache lifetime.
- Email & Distribution, Logging, Updates, About & License and Data Sources.
Use Test Connection (on the ribbon) any time to confirm the add-in can reach Business Central; it should return your list of companies. You're signed out from the Menu.
Ribbon reference
The IBB Reports ribbon tab groups the same actions for quick access:
| Group | Buttons |
|---|---|
| Home | IBB Reports (opens the task pane on the Ask IBB home) |
| Report | Run (menu: Run, Run from Cache, Run in Background), Drill Down, Check Errors, Tools (Unlock, Unhide, Purge Cache) |
| Build | Report Wizard, Balance Sheet, P&L, Insert Function, Pivot Table, AR Aging, AP Aging, Custom reports, Report Designer |
| Distribution | Schedule, Batch Wizard, Word Export, Upload |
| Data | Companies, Test Connection |
| Settings | Settings, Help |
Plans
| Plan | What's included |
|---|---|
| Starter | Core functions: IBB.NL, IBB.NF, IBB.GL, IBB.NP, plus Ask IBB. |
| Pro | Everything in Starter, plus dimensions, financial statements (IBB.FS), the AR and AP aging reports and scheduling. Budget vs Actual and the Report Designer (Budget and By-dimension columns included) work on one company at a time. |
| Enterprise | Everything in Pro, plus every report that combines several companies: consolidated statements, the consolidating statement with intercompany eliminations, GL by Company, P&L by Partner, and Budget vs Actual or Designer reports across all companies. Also client report packs, burst distribution and Power BI / OneLake. |
Your plan is set on your license key. To change it, contact IBB Innovations.
Troubleshooting
The add-in won't load, or shows an old version
Make sure Excel is signed in with the Microsoft work account in the tenant where IBB Reports was deployed (top-right avatar → switch account). A centrally-deployed add-in only appears under its own tenant. If Excel cached an old version, close and reopen the pane, or restart Excel.
“<email> isn't on this license”
For a key-based activation, your email needs to be added to the license key by your administrator. Or start a free trial instead, which needs only your Microsoft sign-in.
A report can't reach Business Central
Run Test Connection from the ribbon. If it doesn't return your companies, the connection is down; check that you're signed in and that your key or trial is active. Re-run after a moment.
A formula shows #BUSY or #N/A
Press Run to refresh, and confirm the active Company in the header is correct. If an in-cell IBB.* function stays on #BUSY, the custom-functions runtime is still starting; give it a minute, or fully close and reopen Excel. For finished reports you can always use the Generate to sheet buttons (Balance Sheet, P&L, AR and AP aging); they render straight to a worksheet and don't depend on the in-cell runtime.
Get support
Email info@ibbinnovations.com and we'll get back to you, usually within one business day. Please include your company name and a short description of what you're seeing. You can also reach support from the pane's Menu → Get support.
More resources: Support · Privacy · ibbinnovations.com